Setting net zero plans based on science-based targets signals a company’s commitment to reducing greenhouse gas (GHG) emissions and advancing environmental stewardship. However, recent setbacks in meeting net zero commitments have raised concerns about organizations’ true commitments to sustainability. In this market landscape, companies face the dual pressures of meeting stakeholder expectations for a low-carbon transition and securing the financial resources necessary to realize these goals.
Setting targets or plans without a comprehensive financial analysis is akin to “putting the cart before the horse.” Like any prospective financial investment, pursuing a science-based target should be preceded by thorough financial due diligence. A full understanding of costs, ROI, solutions, timeline, roadmap, and risks/opportunities should be the foundation for assessing an organization’s capacity to achieve a net zero plan aligned with science-based targets.
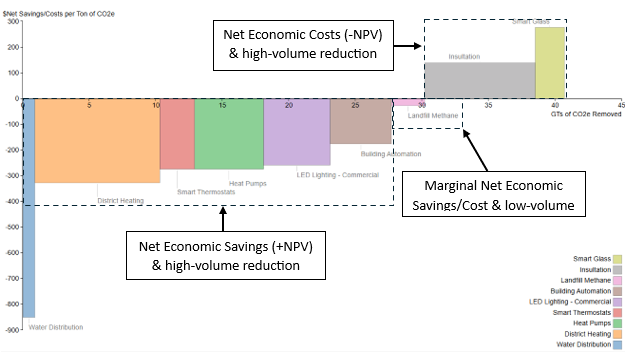
Conducting this type of analysis provides senior management and stakeholders with essential insights to conduct a realistic materiality assessment that prioritizes short, medium, and long-term goals appropriately. One effective tool for understanding the financial investment needed for science-based targets is the Marginal Abatement Cost Curve (MACC). The value of a MACC chart lies in its ability to compare the Net Present Value (NPV) (Y axis) with the volume of GHG emission reductions (X axis) across different abatement solutions in a clear, data-driven visualization. This enables companies to identify the “lowest hanging fruit” – solutions that offer the largest GHG emissions reductions at the lowest costs.
The MACC chart presented below, based on data published by Project Drawdown in 2017 (with updates expected in 2025), shows that two-thirds of the solutions offer a positive NPV, reflecting cost-effective GHG reductions for the building and cities sector. The middle section highlights solutions with minimal costs and modest GHG reductions, while the final section shows options with additional costs beyond their initial investment.
Marginal Abatement Cost Curve

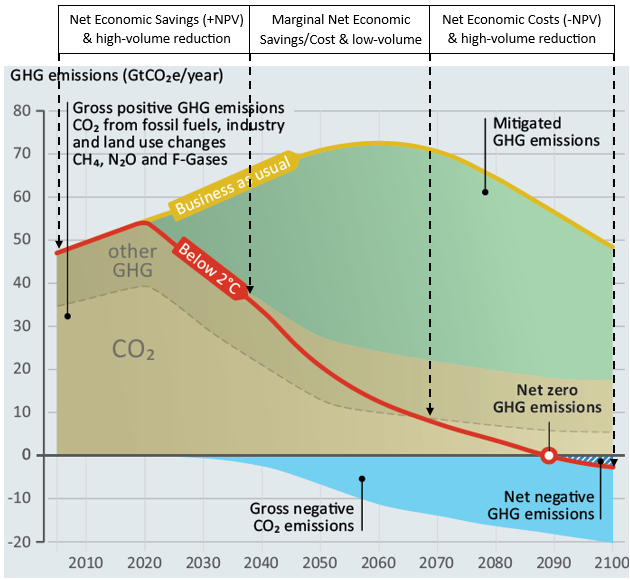
This chart can provide valuable insights when integrated with a net zero plan, helping to prioritize short, medium, and long-term initiatives. It offers stakeholders visibility into how a company balances both the financial and environmental impact of various abatement solutions – an essential component of a comprehensive and transparent dual-materiality assessment. By overlaying these initiatives with prospective Net Zero plan (see the figure below), companies can assess how realistically their plans can be achieved. A credible commitment to a net zero plan is possible only when there is alignment between proposed GHG reductions and the agreed-upon financial investments required to achieve them.
Net Zero Plans and GHG Reduction Solutions

Conclusion
Achieving ambitious GHG reductions requires a robust net zero plan based on science-based targets. However, setting these targets without first conducting through financial due diligence risks compromising the credibility of an organization’s commitment. By performing a comprehensive analysis of emission reduction strategies and their associated costs, companies can build a realistic net zero roadmap that balances environmental impact with financial viability (examples: Unilever, Nestlé, and Coca-Cola). Only through this alignment can businesses demonstrate a credible, transparent, and actional commitment to sustainability – one that meets both stakeholder expectations and environmental goals.


